Motivation
Most of my motivations for projects come from a desire to do a real world application or solution to a problem I see, and this is also the case in this project. Because I have a background in advertising, but hate traditional forms of advertising where it’s just an attempt to manipulate the consumer, I actually like the models were there’s value provided to the consumer in the form of a product like this one and in turn an impression is gathered at the right time to be sold. To explain further, in this case if we found an ad for a sports related product, wouldn’t we be less annoyed than if it were placed right before a song we want to hear? Where we feel it more like an interruption rather than something that come in at the right time with the right mood? Free digital products are a win/win in that regard for both consumer and advertiser, though this data gathering needs to be put in check, and is currently a highly debated topic.
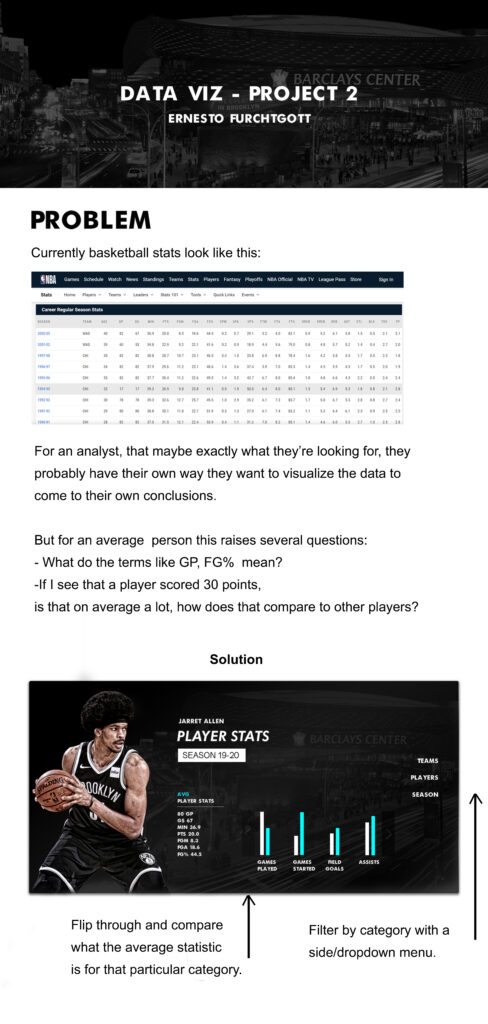
Design
The impulse to design something that is alluring to the common sports-like aesthetic is difficult to overcome. Most if not all sports related imagery needs to be dynamic and in this case I wanted to create a dashboard that really appealed to that, specially since what I’m looking for is actually making it more dynamic for the user, and not have it be plain numbers, and try to provide an more immersive experience.
Transitions and interactivity
The image on the left side (the player) is intended to switch as a right-fade-in motion depending on what player or team select. The controllers next to the graph bars switch the stats that you want to see, and the dropdown menu to the right lets you switch teams, players and seasons.
Data
The data can be found in the NBA official site, and is easy to download.
Early sketches and ideas.

